In this short post, you will learn how to create a basic plot with Python. To create a plot we will use Matplotlib.
What is Matplotlib?
Matplotlib is a package used to draw charts with Python. Often it is used via Jupyter Notebook which is a web application where you can interactively write and run Python code. In Jupyter, you can see the charts directly in the browser. However, you will mostly work with scripts that create the data visualizations as files.
In many cases where charts are to be created, data is stored in data types whose structure is optimized to perform mathematical operations quickly. The package that provides these is NumPy. The NumPy package is usually imported with:
import numpy as npData Visualization in Python
Below you will find an example of how matplotlib is used to draw a diagram and save it to file. First, you need to import matplotlib and the plot (to draw the graphics):
import matplotlib
import matplotlib.pyplot as plt
Second, to save the plots as .png files we use the following command:
matplotlib.use('AGG')
Third, you type the following (into your script) to create the plot:
plt.figure()

plt.plot([1, 2, 75, 6, 7])
plt.ylabel('The label is useless in this plot example')

plt.savefig("data_visualization_in_Python_example.png")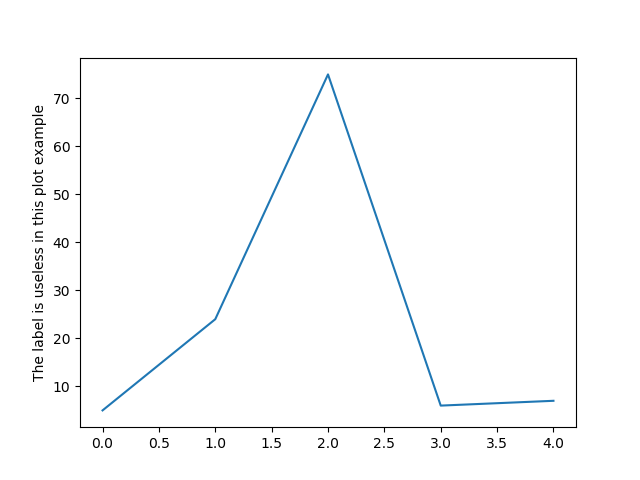
Briefly about the plot function()
The package matplotlib has a module called pyplot. In the pyplot module, the plot() function is defined that we use to draw simpler graphs.
Other libraries to use when doing data science:
- Pandas is also great for data wrangling, plotting, and descriptive statistics.
- Seaborn is easier to use, and a wrapper around matplotlib
- Statsmodels for data analysis
Make sure to check this site for Pandas Python Tutorials, data visualization, data analysis, and many more neat guides and how-tos for programming.
That’s all! Let me know if you need anything!

